Logging with ElasticSearch, Kibana, ASP.NET Core and Docker
A Step by Step Guide to Logging with ElasticSearch, Kibana, ASP.NET Core 3.1 and Docker
Published by Carlo van Wyk on March 28, 2020 in ASP.NET Core

In this tutorial, I’ll show you how you can get up and running with ElasticSearch, Kibana and ASP.NET Core 3.1
Before we get started, let’s look at what ElasticSearch, Kibana and Serilog are.
What is ElasticSearch?
In simple terms, ElasticSearch is an open source database that is well suited to indexing logs and analytical data.
What is Kibana?
Kibana is an open source data visualization user interface for ElasticSearch. Think of ElasticSearch as the database and Kibana as the web user interface which you can use to build graphs and query data in ElasticSearch.
What is Serilog?
Serilog is a plugin for ASP.NET Core that makes logging easy. There are various sinks available for Serilog - for instance you get plain text, SQL and ElasticSearch sinks to name a few.
Why is ElasticSearch so popular?
Apart from the fact that logging is a requirement for just about every application, ElasticSearch solves a number of problems and does it really well:
- It’s free and open source
It’s free. Well almost. The basic features are free, well mostly. If you need security and alerting features in Kibana, you can buy the commercial X-pack subscription for Kibana, or you can install some open source alternatives. - RESTful API
ElasticSearch has a RESTful API. Query results are returned in JSON which means results are easy to work with. Querying and inserting data via the RESTful API means it’s easy to use any programming language to work with ElasticSearch. - Easy to Query
ElasticSearch has a built-in full-text search engine that is based on Apache Lucene. Compared to other databases, Lucene is easy to query. Even non-technical people would be able to write common queries. - It’s fast - very fast
Querying a large SQL database can easily take 10 or 20 seconds. It’s quite common for similar queries on a large ElasticSearch database to return results in under 10 milliseconds. - It’s scalable
It’s easy to scale. Combined with the fact that it's open source means it's easy on the wallet too. - Easy to Set Up
Just fire up a docker compose file containing ElasticSearch and Kibana containers and you’re ready to start logging and searching.
Why do I need ElasticSearch and Kibana?
If you’ve ever built an application, you need logging. We all log errors, but how often are those error logs stored in a text file that is inaccessible somewhere on a server? ElasticSearch makes any kind of logging easy, accessible and searchable.
ElasticSearch’s incredible speed and simple query language coupled with Kibana’s interface and graphs make for a powerful 2 punch combo. If you’re not using ElasticSearch for logging yet, I highly suggest you start using it.
Enough with all the information. Let’s start coding.
I’ll use Visual Studio Code, an open source, cross-platform code editor. For the purposes of this tutorial, I’ll use Mac OSX, but you can use Ubuntu or Windows 10.
Prerequisites
To follow along, make sure you have the following installed:
- Docker
- Visual Studio Code
- .NET Core SDK 3.1 or later
Launching Elasticsearch and Kibana in Docker
Before we start coding in .NET Core, it's important to first spin up the Elasticsearch and Kibana containers. The easiest way to spin up these containers is to create a docker-compose.yml file.
mkdir -p elastic-kibana/src/docker
cd elastic-kibana/src/docker
Create a new file named docker-compose.yml:
version: '3.1'

services:

  elasticsearch:
   container_name: elasticsearch
   image: docker.elastic.co/elasticsearch/elasticsearch:7.9.2
   ports:
    - 9200:9200
   volumes:
    - elasticsearch-data:/usr/share/elasticsearch/data
   environment:
    - xpack.monitoring.enabled=true
    - xpack.watcher.enabled=false
    - "ES_JAVA_OPTS=-Xms512m -Xmx512m"
    - discovery.type=single-node
   networks:
    - elastic

  kibana:
   container_name: kibana
   image: docker.elastic.co/kibana/kibana:7.9.2
   ports:
    - 5601:5601
   depends_on:
    - elasticsearch
   environment:
    - ELASTICSEARCH_URL=http://localhost:9200
   networks:
    - elastic

networks:
  elastic:
    driver: bridge

volumes:
  elasticsearch-data:
Then, run the docker compose command in the docker folder to spin up the containers.
docker-compose up -dThe first time you run the docker-compose command, it will download the images for ElasticSearch and Kibana from the docker registry, so it might take a few minutes depending on your connection speed.
Once you've run the docker-compose up command, check that ElasticSearch and Kibana are up and running.
Verify that Elasticsearch is up and running
Navigate to http://localhost:9200

Verify that Kibana is up and running
Navigate to http://localhost:5601 to ensure Kibana is up and running
Logging to Elasticsearch using ASP.NET Core and Serilog
Now that the Elasticsearch and Kibana containers are up and running, we can start logging to Elasticsearch from ASP.NET Core.
I'll start off by creating a new .NET Core MVC project with the .NET Core CLI
dotnet new mvc --no-https -o Elastic.Kibana.SerilogOpen the project in Visual Studio Code
cd elastic-kibana/src/Elastic.Kibana.Serilog
code .
Adding Nuget Packages to the Project
We'll add the following Serilog packages to the project:
- Serilog.AspNetCore
- Serilog.Enrichers.Environment
- Serilog.Sinks.Debug
- Serilog.Sinks.ElasticSearch
cd ..
cd elastic-kibanadotnet add package Serilog.AspNetCore
dotnet add package Serilog.Enrichers.Environment
dotnet add package Serilog.Sinks.Debug
dotnet add package Serilog.Sinks.Elasticsearch
dotnet restoreAdding Serilog log level verbosity in appsettings.json
The default appsettings.json contains a logging section that isn't used by Serilog.
{
  "Logging": {
    "LogLevel": {
      "Default": "Information",
      "Microsoft": "Warning",
      "Microsoft.Hosting.Lifetime": "Information"
    }
  },
  "AllowedHosts": "*"
}
Remove the Logging section in appsettings.json and replace it with the following configuration below so that we can tell Serilog what the minimum log level verbosity should be, and what url to use for logging to Elasticsearch.
{
  "Serilog": {
    "MinimumLevel": {
      "Default": "Information",
      "Override": {
        "Microsoft": "Information",
        "System": "Warning"
      }
    }
  },
  "ElasticConfiguration": {
    "Uri": "http://localhost:9200"
  },
  "AllowedHosts": "*"
}
Configuring Logging in Program.cs
Next, configure logging in Program.cs by adding the following using statements:
using Microsoft.AspNetCore.Hosting;
using Microsoft.Extensions.Configuration;
using Microsoft.Extensions.Hosting;
using Serilog;
using Serilog.Sinks.Elasticsearch;
using System;
using System.Reflection;
Next, setup the main method. What we want to do is to set up logging before we create the host. This way, if the host fails to start, we can log any errors.
public static void Main(string[] args)
{
	//configure logging first
	ConfigureLogging();

	//then create the host, so that if the host fails we can log errors
	CreateHost(args);
}
Then, add the ConfigureLogging and ElasticsearchSinkOptions methods in Program.cs
private static void ConfigureLogging()
{
	var environment = Environment.GetEnvironmentVariable("ASPNETCORE_ENVIRONMENT");
	var configuration = new ConfigurationBuilder()
		.AddJsonFile("appsettings.json", optional: false, reloadOnChange: true)
		.AddJsonFile(
			$"appsettings.{Environment.GetEnvironmentVariable("ASPNETCORE_ENVIRONMENT")}.json",
			optional: true)
		.Build();

	Log.Logger = new LoggerConfiguration()
		.Enrich.FromLogContext()
		.Enrich.WithMachineName()
		.WriteTo.Debug()
		.WriteTo.Console()
		.WriteTo.Elasticsearch(ConfigureElasticSink(configuration, environment))
		.Enrich.WithProperty("Environment", environment)
		.ReadFrom.Configuration(configuration)
		.CreateLogger();
}

private static ElasticsearchSinkOptions ConfigureElasticSink(IConfigurationRoot configuration, string environment)
{
	return new ElasticsearchSinkOptions(new Uri(configuration["ElasticConfiguration:Uri"]))
	{
		AutoRegisterTemplate = true,
		IndexFormat = $"{Assembly.GetExecutingAssembly().GetName().Name.ToLower().Replace(".", "-")}-{environment?.ToLower().Replace(".", "-")}-{DateTime.UtcNow:yyyy-MM}"
	};
}
Finally, add the CreateHost and CreateHostBuilder methods. Note the try/catch block around CreateHostBuilder.
private static void CreateHost(string[] args)
{
	try
	{
		CreateHostBuilder(args).Build().Run();
	}
	catch (System.Exception ex)
	{
		Log.Fatal($"Failed to start {Assembly.GetExecutingAssembly().GetName().Name}", ex);
		throw;
	}
}

public static IHostBuilder CreateHostBuilder(string[] args) =>
	Host.CreateDefaultBuilder(args)
		.ConfigureWebHostDefaults(webBuilder =>
		{
			webBuilder.UseStartup<Startup>();
		})
		.ConfigureAppConfiguration(configuration =>
		{
			configuration.AddJsonFile("appsettings.json", optional: false, reloadOnChange: true);
			configuration.AddJsonFile(
				$"appsettings.{Environment.GetEnvironmentVariable("ASPNETCORE_ENVIRONMENT")}.json",
				optional: true);
		})
		.UseSerilog();
Start Logging Events to ElasticSearch
Now, run the MVC application by hitting f5 in Visual Studio code, or by typing dotnet run.

Launching Kibana
Since we configured logging in the startup class and set the minimum log level to Information, running the application would have logged a few events to ElasticSearch.
Let's open up Kibana at http://localhost:5601 so that we can view the logs.
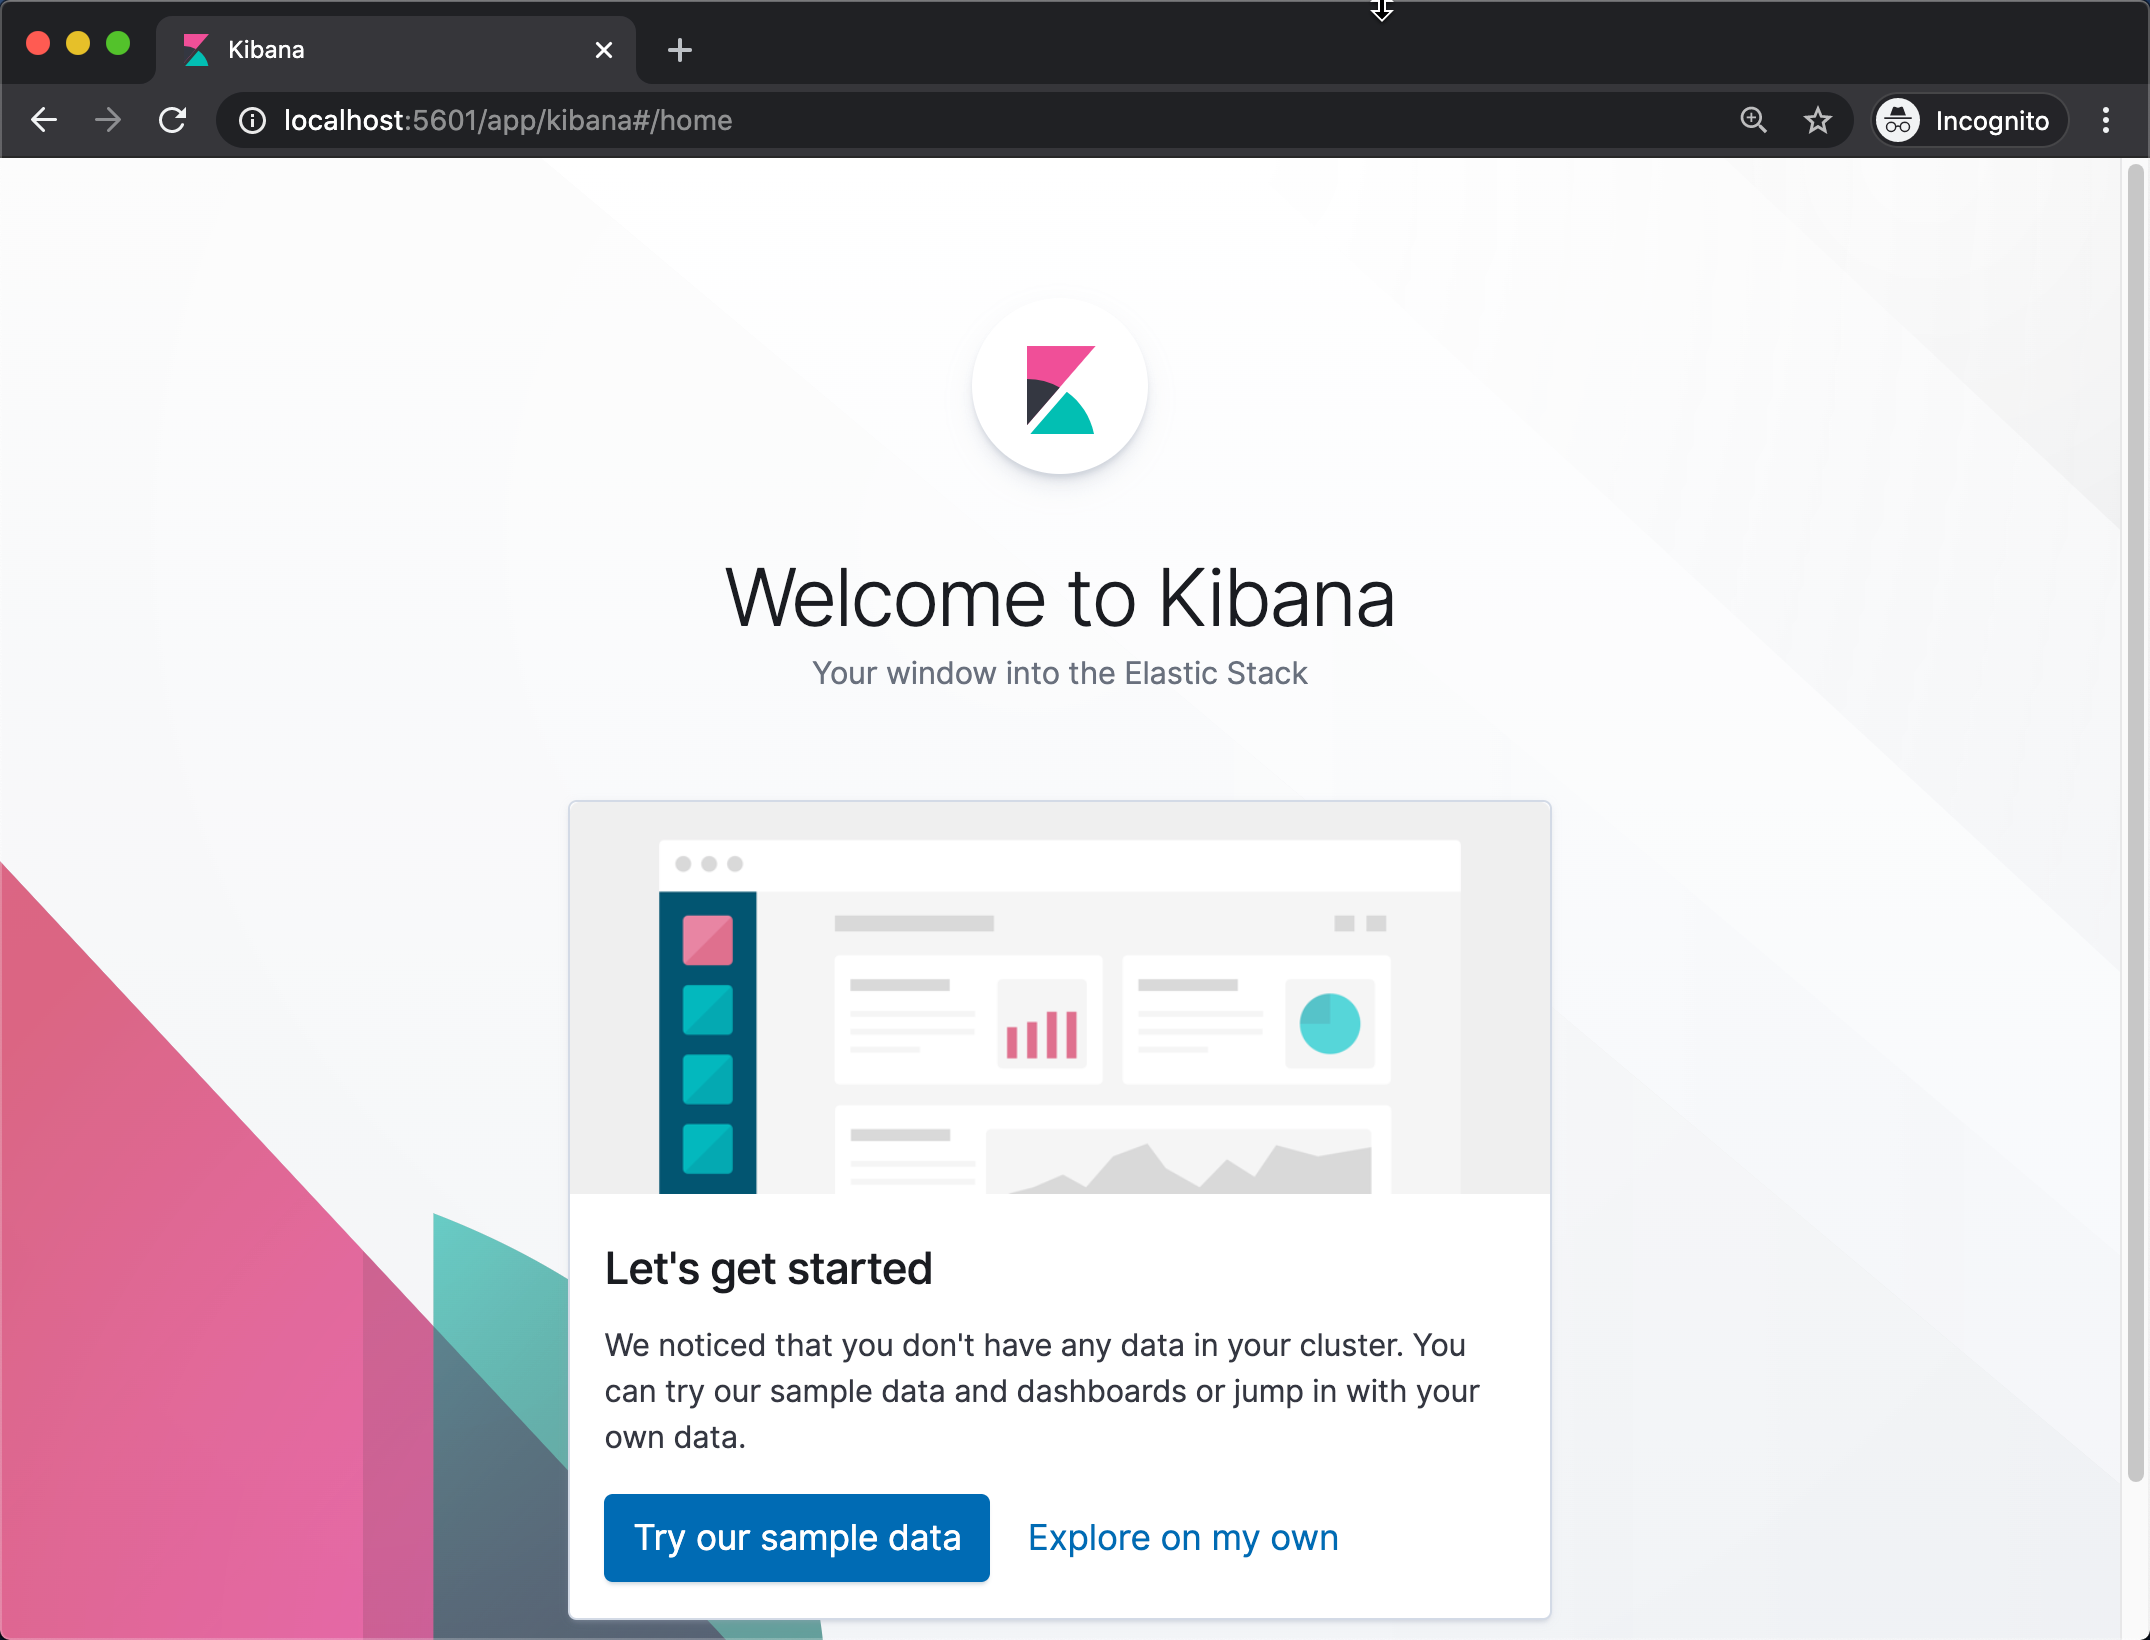
Once Kibana loads, you'll be presented with the default page.

Create an Index Pattern in Kibana to Show Data
Kibana won't show any logs just yet. You have to specify an index before you can view the logged data. To do this, click on the Explore on my own link on the default Kibana page, and then click the Discover link in the navigation.

Then, type in an index pattern. It will show the index pattern that was just created. You can type in the entire index, or use wildcards as shown below.

On the next page, select the @timestamp field as the time filter field name and click the Create index pattern button.

You can now view the logs by clicking the Discover link in the navigation pane.

Logging Custom Messages from an MVC Controller
Since we specified that we want to log messages with a log level of Information or higher, a number of information messages were logged by default. But what if we want to log our own messages? Thankfully, this is pretty easy to do. I'll log a message in the HomeController.
Add a using statement to HomeController.cs
using Microsoft.Extensions.Logging;Then, inject an instance of ILogger with constructor injection.
ILogger<HomeController> _logger;
public HomeController(ILogger<HomeController> logger)
{
    _logger = logger;
}
And finally, log a message in the Index action of the HomeController.
public IActionResult Index()
{
    _logger.LogInformation("HomeController Index executed at {date}", DateTime.UtcNow);

    return View();
}
Searching in Kibana
Now that we've logged a message, refresh the application on http://localhost:5000 again. Then search for the log message text.
message: "HomeController Index"
You can also view the log as a single document in order to see which information was logged against various fields.

I'll show a few basic search examples you could use to demonstrate how easy it is to search in Kibana and how powerful ElasticSearch is:
message: "HomeController Index"level:"Information"fields.ActionName:"Elastic.Kibana.Serilog.Controllers.HomeController.Index"(message:"HomeController Index" AND level: "Information")Logging Errors to ElasticSearch
A typical requirement is to log error messages. It doesn't get any simpler than logging with Serilog as shown below.
try
{
    throw new Exception("Some bad code was executed");
}
catch (Exception ex)
{
    _logger.LogError(ex, "An unknown error occurred on the Index action of the HomeController");
}
Searching for Errors in Kibana
And it's dead simple to find errors in Kibana. I'll simply narrow it down to all logs with a level of error.
level: "Error"Let's take a look at the default level of detail that is logged with Serilog and ElasticSearch.


It's pretty decent, but you'll notice that the exception detail is logged as one big string. Searching for information in this string would still return results, but if the information was logged against specific fields, we could perform more powerful and specific searches. Thankfully, there's a Serilog plugin called Serilog.Exceptions that can help us with that.
Installing the Serilog.Exceptions Nuget Package
Install the Serilog.Exceptions Nuget Package:
dotnet add package Serilog.Exceptionsdotnet restoreThen, add Serilog.Exceptions using statement to the Startup.cs file.
using Serilog.Exceptions;And enrich the Logger with the Serilog.Exceptions plugin
private static void ConfigureLogging()
{
    /// ...

    Log.Logger = new LoggerConfiguration()
        .Enrich.FromLogContext()
        .Enrich.WithExceptionDetails()
        .Enrich.WithMachineName()
        .WriteTo.Debug()
        .WriteTo.Console()
        .WriteTo.Elasticsearch(ConfigureElasticSink(configuration, environment))
        .Enrich.WithProperty("Environment", environment)
        .ReadFrom.Configuration(configuration)
        .CreateLogger();
}
Then, log a new error and search for the newly logged error in Kibana to see the more structured approach to logging with Serilog.

Errors are now being logged in a structured way. For instance, the exception message is being logged in a fields.Exception.Message field, which means that this field is now searchable and indexable.
Turning Down Log Level Verbosity
You'll probably find the Information level logs for a little bit too verbose for your taste. By default, ASP.NET Core will log hosting related events for Microsoft Kestrel server. This can get quite noisy. A simple way to exclude hosting related event is to adjust the appsettings file by setting the Microsoft log level to Warning. Optionally you could restrict logging even further by setting the minimum log level to Error for Default and System as shown below.
"Serilog": {
  "MinimumLevel": {
    "Default": "Error",
    "Override": {
      "Microsoft": "Error",
      "System": "Error"
    }
  }
}
Conclusion
Traditionally, logging required a lot of upfront work to get up and running. As such, logging is usually left out entirely or it's written to some obscure text file on a server that is difficult to access.
ElasticSearch and Kibana changed all of that. And Docker has made it effortless to get both ElasticSearch and Kibana up and running with no effort required. When you think about the powerful functionality that ElasticSearch and Kibana offers, and how performant it is, it's really quite impressive especially considering that it's open source.
Even without plugins like Serilog, logging has become a lot easier in ASP.NET Core compared to ASP.NET, so kudos to the .NET Core team for making an extensible logging framework. Serilog simply built on top of this and extended this functionality by making logging for .NET Core developers an even simpler process.
When you think about all the convenience and functionality you get by combining Docker, ElasticSearch, Kibana, ASP.NET Core and Serilog, there's really no excuse for developers to not incorporate logging into applications anymore.
Code
Clone the Github repository: https://github.com/thecarlo/elastic-kibana-netcore-serilog